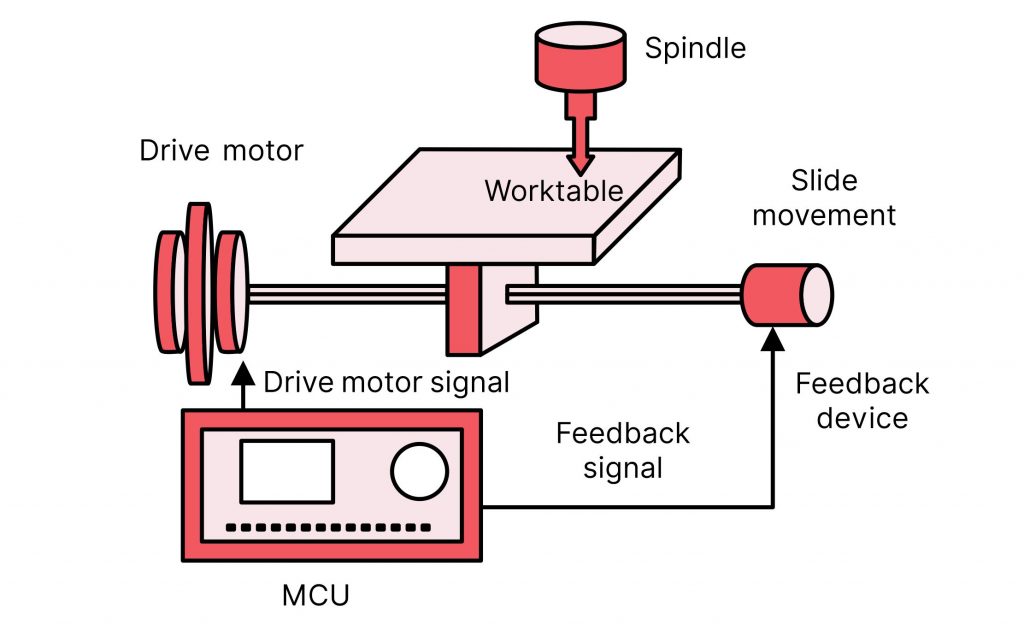
Industrial Automation: Job Growth

The industrial automation sector has seen significant job growth in the past decade. A report by MarketsandMarkets, estimates the global industrial automation market to reach $296 billion by 2023. From 2018 to 2023 the CAGR saw a growth of 6.6%. The adoption of Industry 4.0 and Internet of Things (IoT) technologies, rising labor costs, and a growing need for improved efficiency and productivity have been contributing factors.

This growth in the industrial automation market has also led to an increase in job opportunities in the sector. The International Federation of Robotics (IFR) found industrial automation jobs increased by 2.6 million worldwide between 2010 and 2016. The study also predicted continued job growth in the sector reaching 2.8 million by 2019.

Manufacturing roles aren’t the only jobs increasing in the industrial automation sector. Additionally, industrial automation technologies have led to a growing need for skilled professionals in other areas. These include engineering, programming, and data analysis, according to a report by the Bureau of Labor Statistics. Employment of industrial engineers, for example, projected 8% growth from 2016 to 2026, faster than the average for all occupations.

In addition, the industrial automation sector is also a significant contributor to the growth of the economy. The IFR estimates that every robot installed in the manufacturing industry creates an average of 1.6 jobs. Furthermore, the increasing adoption of industrial automation technologies is also expected to lead to new jobs. These areas can include the installation, maintenance, and repair of automation systems.

In conclusion, the industrial automation sector has seen significant job growth in the past decade, driven by the increasing adoption of Industry 4.0 and IoT technologies, rising labor costs, and a growing need for improved efficiency and productivity. Experts continue to expect this growth in the coming years, leading to an increase in job opportunities not just in manufacturing roles but also in areas such as engineering, programming, and data analysis.

The History of “The New Year”

For thousands of years, New Year celebrations have changed and evolved. Some of the oldest celebrations evidently located in ancient civilizations such as Mesopotamia and Egypt.

In Ancient Times

Ancient Mesopotamia celebrated the new year around the time of the vernal equinox, around March 21st. The Akkadian people, who lived in ancient Mesopotamia, celebrated the new year with a festival called Akitu. This festival included crowing a king and honoring the gods.

Egypt

Ancient Egypt celebrated the new year around the time of the inundation of the Nile, which typically occurred in the month of September.

One of the most important of these was the festival of Wepet Renpet, which honored the god, Ra. During this festival, the Pharaoh would lead a procession to the temple of Ra and offer sacrifices to the god.

Other rituals and ceremonies associated with the Egyptian new year included the reading of the “Book of the Dead.” These were a collection of spells and incantations used to protect the deceased in the afterlife. There also existed an “Opening of the Mouth” ceremony. This gave the deceased the power to speak and eat in the afterlife.

The Egyptians also celebrated the new year with feasts and celebrations. They would decorate their homes and temples with flowers and other decorations. They also held large banquets in honor of the gods.

Rome

The Roman calendar, which was based on the movements of the moon, originally had only ten months. They celebrated the new year on March 1st, calling it the “New Year’s Day of the Consuls.” Later, the Romans reformulated the calendar and the new year moved to January 1st.

A variety of traditions and customs marked the Roman new year. One important tradition, the exchange of gifts, brought good luck for the coming year. The Romans would also decorate their homes with greenery and other decoration. Like the Egyptians, they also held feasts and parties to celebrate the new year.

The Roman Empire also marked the new year by performing religious rituals. The Romans believed that the gods had a special role to play in the new year. They offered sacrifices and perform other rituals to honor them.

Medieval Europe

The celebration of the New Year in Medieval Europe landed on different dates depending on the region. The British Isles celebrated the new year on March 25th, the feast of the Annunciation. For the Catholic Church, December 25th was the feast of the Nativity. They celebrated by singing Christmas carols and exchanging gifts.

Overall, the celebration of the new year in medieval Europe was a time of renewal and a time to look forward to the future. It was a time to come together with family and friends and celebrate the blessings of the past year.

Africa

In Africa, the celebration of the new year varies among different tribes and cultures. Some African tribes mark the new year as a time of renewal and celebrate with rituals, ceremonies, and feasts.

For example, the Ashanti people of Ghana celebrate the new year with the festival of Homowo, which is a time to honor their ancestors and give thanks for the blessings of the past year. During this festival, the Ashanti people hold traditional dances, perform rituals, and prepare special foods.

Other African tribes celebrate the new year with different traditions and customs. The Zulu people of South Africa mark the new year with the Umkhosi woMhlanga, or Reed Dance, which is a celebration of womanhood and fertility. The Maasai people of Kenya and Tanzania celebrate the new year with the Eunoto, a rite of passage for young warriors.

Overall, the celebration of the new year in Africa is a time of renewal and a time to honor the past and look forward to the future. It is a time for families and communities to come together and celebrate the blessings of the past year.

The Modern Celebration

The modern celebration of New Year’s Day on January 1st traces back to the adoption of the Gregorian calendar in the 16th century. In 1582, Pope Gregory XIII implemented the calendar as a way to reform the Julian calendar which had become inaccurate over time. Presently, the Gregorian calendar is the uniform system for determining the dates of holidays and other important events.

Today, countries all over the world celebrate New Year with a variety of traditions and customs. Many countries mark New Year’s Eve with parties, fireworks, and the ringing of church bells at midnight. In other countries, New Year’s Day is a time for family gatherings and the exchange of gifts.

The Best U.S. States for Storm Chasers

Title image of the best U.S. States for Storm Chasers.

If “fear” is not in your vocabulary and “danger” is your middle name, storm chasing may be right up your alley. For individuals who are fearless enough to add “Storm Chaser” to their resume, MRO Electric determined the best states to keep a pulse on hurricanes, tornadoes, and tropical storms in the country. 

In this study, we ranked the top 50 states across the country to chase cyclones based on several factors, including the number of tropical storms, hurricanes, and tornadoes within the past 5 years, average nightly price of temporary accommodations, average travel expenses, and more. Read on to find out if you’re in a hotspot for hurricanes or if you’ll have to venture a little further out to enter the eye of the storm.

Taking the Nation by Storm: The 10 Most Turbulent States

Map depicting the top 10 U.S. states for storm chasing.

Storm chasers looking for a chance to be in the middle of the action should plan a trip to the southern and southeastern regions of the U.S. Our friends down south made up 8 of the top 10 states, making it the place to be for storm chasers all over the nation.

Florida is undoubtedly the place to be for any aspiring storm chaser. The Sunshine State comes in first on our list with a storm chaser score of 80.23. Florida reports more days of tropical storms than any other state in the country and frequently faces other natural disasters, like hurricanes and tornadoes. Average airfare to Florida is also cheaper than any other U.S. state, making it accessible to storm chasers who plan on trekking from parts unknown to catch a glimpse of the carnage.

If you feel tempted to chase after terrible tornadoes, your best bet might be to travel to Illinois or Kansas. These two states are the only states in our top 10 not located in the southern or southeast part of the country. Interestingly, they are also the only states in our shortlist to have reported impacts by only one of the storm types. Their impact from tornadoes being so exceptionally high was enough to put the pair in the top 10.

The Danger Zone: States That Get Hit the Most

Map depicting the U.S. states that get hit the most by storms.

Texas had the highest number of storms at nearly 200 impacts in the past five years alone. When it comes to the sheer number of natural disasters, no one else comes close to touching the Lonestar State. In five years, Texans have had to grapple with 158 days of tornadoes, 7 days of hurricanes, and 12 days of tropical storms. If you’re a veteran storm chaser looking for a challenge, remember everything’s bigger in Texas.

Even though Illinois doesn’t even receive a gold, silver, or bronze medal for states most frequently hit by storms, it definitely deserves an honorable mention. With only reporting impacts from one of the three storm types, it is the 4th state overall to get banged up regularly by storms. In just five years, it has reported nearly 20 tornadoes on average a year.

Though Texas was the state to experience storms the most frequently beyond any doubt, Georgia takes a surprising second for most areas hit by storms. Geographically, Georgia shares borders with four states on our top 10 states with the most areas hit by storms list. Residents in Georgia have to deal with disasters coming from every direction since Alabama, Florida, North Carolina, and South Carolina are more than happy to share some of the action with them.

Closing Thoughts

If you’re no stranger to danger and love the thrill of hunting down disaster, storm chasing might be the perfect hobby for you. Storm chasers who are up for a challenge and a little traveling should head down south if they really want to test their mettle against some of the country’s most terrifying storms and natural disasters. Just remember to keep safety and the cost of accommodation in mind.

Storms pop up in various regions and cause disruptions to our natural way of living. Storm chasers are crucial in tracking the patterns and reporting the conditions of these storms. More often than not, one common occurrence with these harsh weather conditions is power outages across hundreds of neighborhoods. That’s why MRO Electric is committed to ensuring people across the country have access to trustworthy electric and power systems they can depend on during an emergency.

Full Data

That wraps up our state ranking for The Best States for Storm Chasers. Interested in diving deeper into the numbers for all of the states, or wanting to see how your state stacks up if it’s not listed within the above map? 

We’ve compiled our full data study for all 50 U.S. states and the District of Columbia analyzed into the interactive data table below. Search for the state you call home or click on the heading of each column to sort by that category!

Methodology 

To find out the best states for storm chasers, we began with a list of all 50 of the U.S. states and the District of Columbia. We collected data on 10 factors that pertain to or impact storm chasers. We assigned states with a score of 0-5 for each factor, with a score of 5 representing the most favorable conditions. We determined each state’s total score from the total of its individual factor scores, which were weighted according to their impact on storm chasers. Individual factor scores were then added together to give each state a final score from 0-100. Higher scores indicated states that are better for storm chasers. Details on our ranking factors can be found below.

Ranking FactorWeightSource
Number of Days with Hurricanes Reported (in last 5 yrs)1.75NCEI
Number of Days with Tornadoes Reported (in last 5 yrs)2.75NCEI
Number of Days with Tropical Storms Reported (in last 5 yrs)2.75NCEI
Number of County/Zone Areas Affected by Hurricanes1.75NCEI
Number of County/Zone Areas Affected by Tornadoes2.75NCEI
Number of County/Zone Areas Affected by Tropical Storms2.75NCEI
Average Price of Airbnb/Hotels1.50Airbnb
Average Gas Costs by State1.50AAA
Average Airfare Into a State1.00BTS
Average Car Rental Fees1.50Kayak

Covid’s Effect on Automation

The COVID-19 pandemic has had a significant impact on the industrial automation industry, with both positive and negative effects.

The Positive

On the positive side, the demand for automation has increased as companies look for ways to reduce the number of workers on the factory floor and minimize the risk of virus transmission. Automation can help to maintain social distancing guidelines and reduce the need for close contact between workers. In addition, many companies have turned to automation to increase the efficiency and speed of their operations in the face of supply chain disruptions and other challenges caused by the pandemic. According to a report by the Association for Advancing Automation (A3), “the COVID-19 pandemic has spurred increased interest in automation as a means to reduce the risk of infection, improve efficiency, and maintain or increase production levels in the face of supply chain disruptions and other challenges.”

The Negative

On the negative side, the pandemic has disrupted the supply chain for automation equipment and components, leading to delays and shortages. Many manufacturers and suppliers have had to deal with disruptions to their operations due to lockdowns and other measures taken to control the spread of the virus. This has made it more difficult for companies to obtain the equipment and components they need to automate their operations. According to the A3 report, “the COVID-19 pandemic has disrupted the supply chain for automation equipment and components, leading to delays and shortages.”

The pandemic has also had a negative impact on the financial performance of many companies in the industrial automation industry. Many businesses have had to deal with reduced demand and lower revenues due to the economic downturn caused by the pandemic. This has led to a decrease in investment in automation and a slowdown in the growth of the industry. According to a report by the International Association of Automation (IAA), “the COVID-19 pandemic has had a negative impact on the financial performance of many companies in the industrial automation industry, leading to a decrease in investment in automation and a slowdown in the growth of the industry.”

Conclusion

Overall, the COVID-19 pandemic has had a mixed impact on the industrial automation industry. While the demand for automation has increased in some sectors, the disruptions caused by the pandemic have led to delays and shortages in the supply chain and have had a negative impact on the financial performance of many companies in the industry.


Distributed Control System (DCS) Explained

What is a DCS?

A Distributed Control System (DCS) is a computerized control system that streamlines the functionalities of industrial devices used throughout a workspace. A DCS utilizes a wide range of controllers to permit all the parts to converse with one another just as PCs do. These controllers are distributed geographically across a plant to allow for high-speed communication to the control process. When utilizing various kinds of modules, the framework may require diverse correspondence norms, for example, Modbus and Profibus.

What is a Distributed Control System
Distributed Control System Layout
Read More

How Old is “Too Old”?

Upgrading Vs Swapping


When it comes to the world of automation controllers, it is important that a system perform as long as it possibly can. After all, what good is buying a new machine when a company has to shell out millions every few years for a full replacement? That being said, like all things, these systems have their own expiration date. Of course, that expiration time is not an exact number and very much depends heavily on multiple factors. Depending on the facility, management, operator, etc., an entire setup can potentially last up to 30 years if well maintained. In fact, while we are in the year 2022, there are numerous companies today that are still using equipment from the 1980’s with some going back further than that!

“When Should I Upgrade?”

Upgrading your system is a large undertaking for any company. Not only is the cost to upgrade something to really consider. Businesses also have to account for operations, deadlines, and return on investment (ROI). When thinking about upgrading your equipment, some important factors to think about include:

Production Challenges
If you are seeing a higher volume in sales and your current setup cannot meet the rise in demand, then it may be time to consider upgrading. Newer machines can output product at a faster rate.

Labor
Labor is often one of the largests costs when it comes to business operations. Not only are we talking about the base wage of an employee, but also the cost of training. Some fields of work have high turnover rates which makes having to hire and train new employees a constant and expensive venture. Some uprgrades are available that now automate certain tasks once perfomed by employees.

Cost
While the upfront cost might end up being quite a steep price to pay. In the long term, upgrading your equipment can give a business the competitive edge it needs to produce products faster, higher quality, and more efficiently thus saving money on the back end.

Expansion
As a company expands, the prospects of upgrading and automating certain aspects of the production is can not only help saving money in any long-term costs that comes with expansion, but also maintain quality control as the company grows.

Waste
The production of waste is not only an issue that comes with potential environmental and legal rammifications, but also with economical ones as well. The accountability of letting environmental waste go unchecked has long-lasting and very expensive repurcussions. Upgrading to newer equipment can also mean a reduction in waste production as well.

Better Precision
Newer equipment also tends to be more precise with higher accuracy in manufacturing which aids in the produciton of more complex components.

“What if Upgrading Isn’t Worth It?”

As previously mentioned, the greatest obstacle when it comes to upgrading is the upfront costs. Usually companies with enough capital can make these upgrades. Some companies with more limited capital may make incremental upgrades. However, there are plenty of businesses out there that simply do not have the sort of capital needed to commit to upgrading their equipment. This is especially challenging when a company’s equipment suddenly breaks down and needs replacing. The dire need for operations to continue means small turn around times (if any) for machines to be shut down. While this is happening, a company can lose huge sums of money from not having product to sell. Therefore many companies want whatever the quickest turn around time possible to get production back up.

One alternative solution for companies with smaller budgets is to just buy refurbished and certified pre-owned equipment from vendors. The advantage of this being that most components are able to be hot swapped. This allows you to just purchase and replace the broken part and not have invest in completely new machinery. Another advantage of this is that a company can save a lot of time and money by not having their technician needing to learn an entirely new system. Especially when going from a setup that was installed 30 years ago to the newest one.

The End Cost

It is important to take note that when replacing with pre-owned/used parts, these are in fact; used. It is good to make sure a refurbished vendor tests the product before selling it. Some vendors offer, warranties and have return policies in place. That being said, you’re still working with old equipment. The lifespan of used or refurbished items will not have the same longevity as new parts. This means the cost you were hoping to save by a simple part replacement may again end up costing you more down the road.

Ultimately, it is up to the owner to weigh the pros and cons. Afterwards they have to think about long vs short term solutions and if the cost is worth it.

NHL Teams that Travel the Most

There’s nothing more thrilling than attending a sporting event to watch your favorite team take on a tough opponent. Home games are a blast, but traveling to a new city to watch your team can be an equally exhilarating experience. For fans, traveling for one game can be a whirlwind to plan, but athletes are traveling multiple times a week – especially hockey players. 

NHL players have many games a week, and several teams are based outside of the U.S., meaning they spend a lot of time on the road during the season. There’s a lot that goes into getting your favorite players on the ice on time. On average, your favorite NHL team travels nearly 50,000 miles per season!  

For this study, MRO Electric’s resident hockey fanatics analyzed how many miles each team is slated to travel based on the upcoming season.

Methodology

To gear up for hockey season (and for this study), we reviewed each team’s schedule on ESPN to see where everyone will skate off to. Next, we used Google Maps to calculate the mileage between each hockey game of the 2022-2023 season for every team in the league. This study assumes that each NHL team is driving to and from each game and doesn’t need to travel elsewhere for personal reasons. We measured the travel time back to home ice, meaning that if a team spent multiple games on the road, we calculated the distance between each venue on the road and then the trip home. Finally, we found which teams travel the most and which individual games require the most miles to get from point A to point B.

Top 10 NHL Teams Traveling the Most Miles in 2022-2023 Season

If your favorite hockey team is a part of the pacific division, chances are your star players are traveling far and wide to push the puck. Pacific division NHL teams account for seven of our top 10 most traveled teams. The majority of teams in this division have at least a handful of games that require trekking over 2,000 miles and several more that clock in at just over 1,000 miles. Not only that, but the league’s average distance for an away game overall is just over 19,000 miles. Talk about going the distance!

The most well-traveled team in the league is Edmonton’s own Oilers. The Oilers claim the unofficial title of the NHL’s top road warriors, traveling over 5,000 more miles than any other hockey team in any division. The Edmonton Oilers have nine games that require them to travel 2,000 miles or more to get to. Oiler fans in the Sunshine State who support them on November 12th will have traveled nearly 3,000 miles to get there.

Another Pacific dream team to go the distance is the Anaheim Ducks. On October 18th, Anaheim’s beloved Ducks travel over 2,000 miles to face off against the New York Islanders. New York is a fighting city and the Anaheim Ducks are a tough bunch to tussle with. Fun fact: these mighty mallards came in second place last season for most fights on the ice. Can you blame them though? Any hockey team that is jet-lagged is bound to be a little crabby.

Many of the league’s east coast teams have the luxury of being some of the least-traveled hockey teams, but one unlucky franchise has to hit the road more than the others. The only team in the NHL’s metro division to make our top 10 list was the Carolina Hurricanes. Caniacs (that’s Carolina-speak for huge Hurricanes fans) have to travel nearly 2,800 miles from Raleigh to San Jose to support the Cardiac Canes at their most distant away game of the season.

Hitting the Road: Games with the Highest Mileage

Teams on the road travel great distances to compete against each other on enemy territory. Many teams in the league will have a few consecutive games away from having home-ice advantage. Not only is it tough to be away from home for extended periods of time, but it’s even worse when you’re getting booed for being on the wrong team. 

If you ever question your favorite team’s commitment to the game, consider that the distance the NHL would travel as a whole this season would take you around the globe 63 times and from LA to NY 569 times! Truthfully, NHL teams go through many hoops to play their hearts out game after game. For fans wondering how far their teams will go to put on a good show, here’s a closer look at some games that require the most travel from rink to rink.

We’re certain that the New York Rangers will not be feeling the love during Valentine’s day week this hockey season. The Rangers have to travel just over 3,000 miles after rallying against Raleigh’s Carolina Hurricanes to face off with the Vancouver Canucks on February 15th. That’s a lot of pressure– winning against the Canucks could mean breaking a few fans’ hearts in Vancouver. Oh well, all is fair in love and hockey.

The most gas-guzzling NHL game of the regular season takes place in the Emerald State, where the Boston Bruins will take on the Seattle Kraken. The Bruins will have to travel a total of 3,006 miles to take a shot at Seattle. The only two hockey games on our list of games with the highest mileage not involving our friends in the Great White North both feature Boston in some way. In December, the Los Angeles Kings will journey 2,985 miles to square off with the Bruins in Bean Town.

Closing Thoughts

Whether your favorite hockey team has the home-ice advantage or not, cheering them on against a fierce competitor can be an emotional whirlwind. The truth is, your commitment to your favorite team means a lot to them– especially when they’re in enemy territory. NHL hockey players travel between cities and sometimes countries multiple times a week to make it to the game. There are many moving parts that go into making sure your favorite players safely get from venue to venue, so consider that next time you cheer them on against a tough rival team!


In the same way, your favorite NHL team has a lot of moving parts and players, your business needs a solid system and plan to make it all happen. As a premier factory automation wholesale distributor, MRO Electric can help your business by working with the best manufacturers to get you the best parts to get the job done.