Industrial automation systems have revolutionized manufacturing and processing industries, improving efficiency and productivity. However, with the increasing complexity of machinery, ensuring worker safety has become a significant challenge. Safe Torque Off (STO) is an essential safety feature in industrial automation system. Its key design is to mitigate risks and protect personnel and machinery.
What is Safe Torque Off
Safe Torque Off (STO) is a critical part of the overall functional safety framework compliant with international standards such as IEC 61508 and ISO 13849. The primary purpose of STO is to ensure the controlled and safe deactivation of the torque produced by electric motors. This stops the motion of machinery in a controlled and secure manner. It allows for the decoupling of the motor from the load, ensuring that it cannot generate any motion or torque.
This holiday season, it isn’t Santa who does all the work behind the scenes— it’s your city’s delivery drivers! Delivery drivers are the vital link between online clicks and the gratifying thump of a package arriving on the doorstep. Whether it’s that last-minute gift for the in-laws or more holiday decor, they’re the unsung heroes who make it happen. Yet, the delivery driving experience can differ dramatically from one city to the next.
We put 100 U.S. cities under the microscope, examining factors like hourly wages, road conditions, availability of public restrooms, and more to discern where your presents will be delivered with ease and where drivers will struggle most to play Mr. Claus. Curious about where your city stands? Buckle up, and let’s hit the road!
The under evaluating of surge protectors is not something that is exclusive to the world of industrial automation. People tend to buy them for their multiple outlet utility overlooking their actual value. However, surge protectors play a very pivotal role in the function and protection of our devices. Often their importance goes unrecognized until of course disaster strikes. In the world of industrial automation, the importance of surge protectors is just as important yet overlooked as ever.
In today’s world of automation and robotics, precise control of machinery is critical. The ability to control the position, velocity, and acceleration of moving parts with pinpoint accuracy is essential. This is regardless of whether it’s in manufacturing, robotics, or aerospace. This is where AC servo motors come into play. These advanced electric motors have revolutionized the way we control and automate complex mechanical systems. In this article, we will delve into what AC servo motors are, how they work, and their applications.
In today’s technologically advanced world, electrical equipment plays a pivotal role in our daily lives. From industrial machinery to household appliances, these devices power our world. However, the safety and functionality of electrical equipment is not just about proper installation and maintenance. It also involves understanding and implementing the appropriate protection standards. One essential aspect of this is NEMA ratings.
NEMA, or the National Electrical Manufacturers Association, is a trade association based in the United States that represents manufacturers of electrical equipment. NEMA ratings are a standardized system used to classify and define the level of protection an electrical enclosure or housing provides against environmental elements, such as dust, water, and corrosive substances. These ratings are essential for selecting the right equipment for specific applications, ensuring durability, and maintaining safety standards.
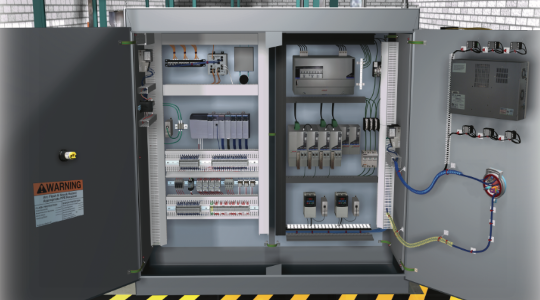
When it comes to the debate on what what is the most crucial device in industrial automation; there exists and spectrum of varying opinions. Some argue that the VFD’s (Variable Frequency Drives) play the most crucial role. Others would believe that it is the motors themselves seeing as without their power and movement nothing can get done. Ultimately all components in industrial automaton are crucial. However unless an operator can give commands for a function, the entire process doesn’t happen. In order to achieve this, the operator has to be able to give commands to a symphony of devices. He conducts orchestra of machinery on when and how to play. This where the industrial control panel comes into play.
Have you ever used a dimmer on a lamp or room light and wondered how you were able to adjust the brightness of light so easily? How about a running fan in your room on a hot day? Ever wondered what it was that allowed you to change how fast the fan went? Maybe you work at an assembly plant, and see the machines moving and performing tasks with precise speed and timing. Has it ever crossed your mind as to how these giant machinations can do such complicated things and not breakdown or catastrophically collide into one another? That is the wonder known as the Variable Frequency Drive or VFD.
So WTF is a VFD?
Variable Frequency Drives (VFDs), alternatively referred to as Variable Speed Drives (VSDs) or Adjustable Frequency Drives (AFDs), constitute a fundamental aspect of industrial automation. These electronic devices are meticulously engineered to govern the speed and torque of electric motors. They achieve tha by manipulating the frequency and voltage supplied to them. By exerting control over these parameters, VFDs grant the ability to finely regulate motor speeds. This results in optimized operational efficiency and performance across a wide array of industrial applications.
In the realm of industrial automation, VFDs offer a multifaceted range of advantages. Among their most prominent benefits is the potential for substantial energy conservation. By permitting motors to operate at lower speeds when maximum power output isn’t essential, VFDs contribute to marked reductions in power consumption, thereby fostering an environment of heightened energy efficiency. Moreover, these drives contribute significantly to the realm of process control and productivity enhancement. Through the implementation of gradual acceleration and deceleration of motors, VFDs curtail mechanical stress and wear on machinery, leading to prolonged equipment lifespan and diminished maintenance expenditures. Their capacity for intricate adjustments further facilitates seamless synchronization with other processes and components, ultimately culminating in elevated product quality and consistency within the sphere of manufacturing and production.
A Brief History in VFD’s
The history of Variable Frequency Drives (VFDs) traces back to the mid-20th century. During this time advancements in power electronics and control systems set the stage for their development. The initial concept of controlling motor speeds by varying the frequency of the power supply emerged in the 1960s. However, the state of electronics at the time limited the technology. The 1970s saw the advent of solid-state devices like thyristors and later insulated gate bipolar transistors (IGBTs). These components enabled more efficient and precise control over motor speeds by allowing the modulation of voltage and frequency.
By the 1980s, the electronics industry had made significant strides, making VFDs more practical and cost-effective. Advances in microprocessors and digital control algorithms led to the emergence of more sophisticated and versatile VFD systems. These drives gained traction in various industries where precise speed control and energy efficiency were crucial. Some examples include HVAC systems, pumps, and conveyors. The turn of the millennium saw further improvements in power electronics, enabling higher switching frequencies and greater efficiency. Additionally, advancements in communication protocols and networking facilitated seamless integration of VFDs into larger industrial automation systems.
How Are VFD’s Used
Variable Frequency Drives (VFDs) operate based on the principles of pulse width modulation (PWM) and voltage-frequency control. These drives consist of three main components: a rectifier, a DC bus, and an inverter. The process begins with the rectifier, which converts the incoming AC power supply into DC voltage. This DC voltage is then stored in the DC bus, creating a stable power source. The inverter stage is where the magic happens. The VFD generates variable frequency AC output by rapidly switching the DC voltage from the bus into a series of pulses through the inverter’s transistors. The width of these pulses determines the effective voltage and frequency delivered to the motor, effectively controlling its speed and torque.
To elaborate on the concept of pulse width modulation (PWM), imagine turning a light switch on and off very rapidly. When the switch is on, the light receives full power, and when it’s off, the light receives no power. By adjusting the duration of the on and off states, you can regulate the average power delivered to the light, thus controlling its brightness. Similarly, VFDs use PWM to regulate motor speed. The width of the output pulses corresponds to the voltage and frequency applied to the motor. By adjusting this pulse width, VFDs can provide a wide range of speeds, allowing precise control over the motor’s performance.
Voltage-frequency control is another fundamental aspect of VFD operation. The relationship between voltage and frequency needs to be maintained within certain limits to prevent overloading the motor. As the frequency changes, the VFD adjusts the voltage to maintain an appropriate ratio. For example, as the frequency is reduced to slow down the motor, the VFD decreases the voltage proportionally to ensure the motor’s torque remains consistent. Conversely, at higher frequencies, the VFD increases the voltage to sustain the motor’s torque output. This coordinated adjustment of voltage and frequency ensures the motor operates within its safe and efficient operational range, enabling seamless control over its speed and performance in various industrial applications.
What Uses a VFD?
Implementing VFDs in industrial settings involves careful planning and integration to harness their benefits effectively. First, a thorough assessment of the application’s requirements and the specific motor system is necessary. This includes considering factors like load characteristics, torque demands, and desired speed ranges. Once the appropriate VFD is selected, the installation process involves connecting the drive to the motor and the power source. It’s essential to ensure proper grounding, wiring, and following manufacturer guidelines for correct setup.
After physical installation, configuring the VFD settings becomes crucial. This involves programming parameters such as motor nameplate data, acceleration and deceleration rates, maximum and minimum speed limits, and control modes (e.g., open-loop or closed-loop control). Advanced VFDs might also offer features like communication interfaces (such as Modbus or Ethernet) to integrate with larger automation systems for centralized control and monitoring. Careful tuning of these parameters ensures that the VFD operates optimally, delivering the desired motor performance while minimizing energy consumption and wear on equipment.
Implementing VFDs also requires considerations for safety and maintenance. Properly trained personnel should handle VFD installation and configuration to prevent accidents. Regular maintenance and periodic inspections are necessary to ensure the drives and associated components are functioning correctly. Monitoring for anomalies, such as overheating or unusual noises, can help detect potential issues early and prevent costly downtime. As technology evolves, the implementation of VFDs might also involve exploring predictive maintenance strategies that leverage data analytics and sensors to anticipate maintenance needs and enhance system reliability.
Conclusion
VFDs stand as a testament to synergy between technological innovation and industrial efficiency. VFDs have transformed the way we control and optimize electric motor-driven systems. Not only do VFDs empower industries to achieve unparalleled precision and performance through dyanmic controls. They also contribute significantly to energy conservation, equipment longevity, and process refinement. As industries continue to evolve and prioritize sustainability, VFDs will undoubtedly remain at the forefront of this evolution. VFDs continue to drive innovation, enhance productivity, and leading to a more efficient and environmentally conscious industrial landscape.